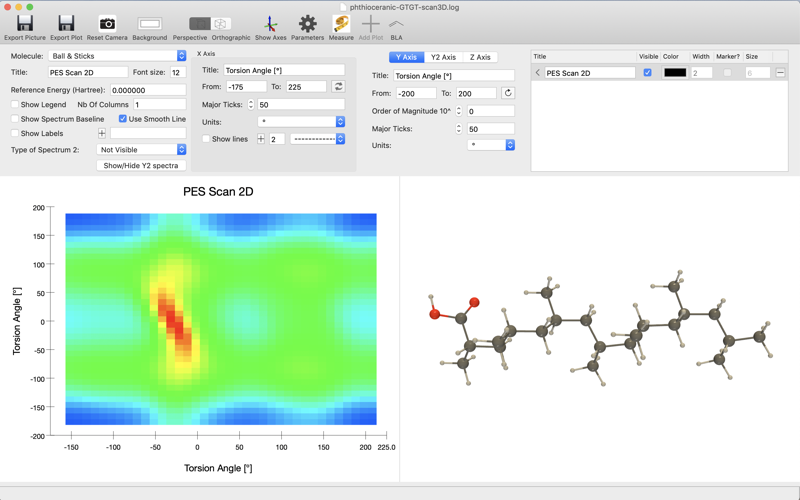
DrawProfile is a powerful graphical interface to visualise and analyze the energy profile along an optimization, along a reaction coordinate, or along a distance, angle or dihedral angle PES scan.
CITATION
If you use DrawProfile for your scientific work, please site DrawProfile program in your papers:
DrawProfile, Vincent LIEGEOIS, UNamur, www.unamur.be/drawprofile
All papers that cite DrawProfile will be listed on the website
FUNCTIONALITIES
With DrawProfile, you can:
A) Plot the energy during an optimization of geometry.
B) Plot 1D and 2D energy scan.
C) Plot energy profile along a reaction coordinate.
D) Plot relative energy with respect to a reference value.
E) Select the unit of energy between Hartree, eV, cal/mol, kcal/mol, J/mol,
kJ/mol values.
F) Plot the change of a distance, angle, or dihedral angle along the x axis.
ATTENTION: DrawProfile mainly open Gaussian (www.gaussian.com) log files and Gamess US (http://www.msg.ameslab.gov/gamess) log files.
CONTACT AND HELP
If you have any issue, please send an e-mail at [email protected]


